In serverless architectures, where infrastructure management is abstracted away, observability becomes the key to understanding application performance, debugging issues, and ensuring reliability. Without proper observability, diagnosing problems in a distributed, ephemeral environment can feel like finding a needle in a haystack. In this blog post, we’ll explore what observability means in serverless applications, why it’s important, and how to implement it effectively.
What is Observability in Serverless?
Observability refers to the ability to monitor, debug, and gain insights into your application’s behavior. It goes beyond simple monitoring by collecting, analyzing, and correlating data to comprehensively understand your application’s performance and health.

In serverless architectures, observability encompasses:
1. Metrics
- Invocation count: How often functions are executed.
- Execution duration: Time taken for a function to complete.
- Error rates: Frequency of failed executions.
- Throttling counts: Requests throttled due to resource limits.
- Resource utilization: Memory, CPU, and network usage of serverless functions.
2. Logs
Logs provide granular details of your application’s behavior:
- Function logs: Application-specific logs (e.g., debugging messages).
- System logs: Logs from AWS services like API Gateway, DynamoDB, or SES.
- Cold start logs: Logs indicating initialization delays (cold starts).
- Error logs: Details about runtime errors.
3. Distributed Tracing
Tracing allows you to track a request as it traverses multiple services. This includes:
- End-to-end latency: Total time taken by a request.
- Service dependencies: Understanding interactions between components.
- Bottleneck identification: Finding slow or failing components.
Why is Observability Crucial in Serverless?
Unlike traditional architectures, serverless applications introduce unique challenges:
- Ephemeral Nature of Functions: Functions spin up and shut down quickly, leaving little time for debugging.
- Complexity of Distributed Systems: Serverless architectures often involve multiple services like API Gateway, Lambda, DynamoDB, and SES.
- Cold Starts: Observability helps detect and mitigate delays caused by cold starts.
- Cost Management: Monitoring resource usage ensures cost optimization by identifying inefficient functions.
With proper observability, you can:
- Ensure high availability.
- Debug issues quickly.
- Optimize performance.
- Maintain control over operational costs.
How to Add Observability to Your Serverless Application
1. Leverage Built-in AWS Tools
AWS CloudWatch

- Collects metrics, logs, and alarms for your AWS resources.
- Key Features:
- Metrics: Tracks function invocations, duration, errors, and throttles.
- Logs Insights: Allows querying and analyzing logs.
- Dashboards: Visualizes application performance.
AWS X-Ray
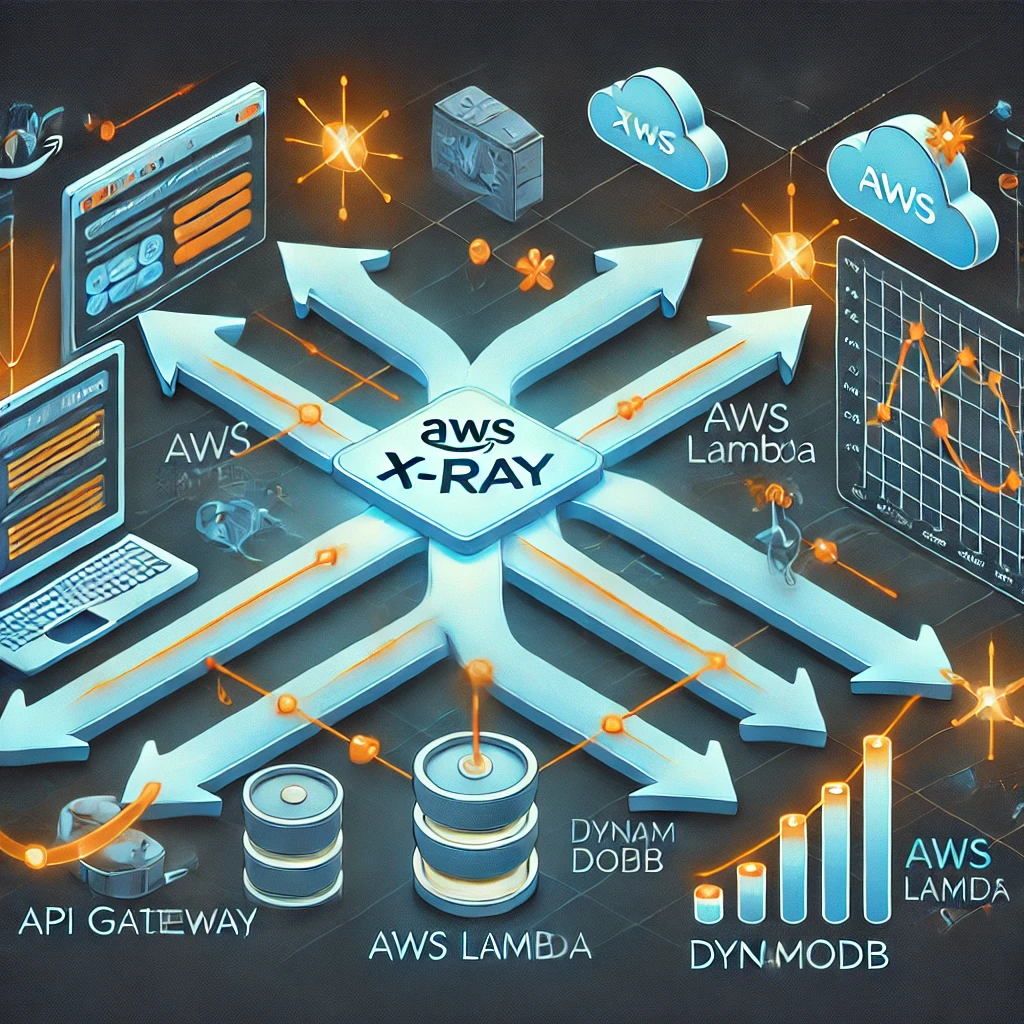
- Provides distributed tracing for AWS services.
- Key Features:
- Service maps: Visualizes how requests flow through your architecture.
- Latency analysis: Identifies bottlenecks.
- Error tracking: Locates failing components.
2. Use Third-Party Observability Tools
While AWS offers robust built-in tools, third-party solutions can provide enhanced capabilities:
- Datadog: Full-stack monitoring with detailed traces and metrics.
- New Relic: Comprehensive observability platform for distributed applications.
- Lumigo: Purpose-built for serverless debugging and tracing.
- Epsagon: Simplifies monitoring and troubleshooting for serverless environments.
3. Adopt Structured Logging
- Use JSON format for logs to make them machine-readable and easy to analyze.
- Include metadata such as
RequestId,TraceId, andUserIdto correlate logs, metrics, and traces.
4. Implement Custom Dashboards
- Tools like Grafana can be integrated with AWS CloudWatch for customizable, visually appealing dashboards.
5. Automate Monitoring and Alerts
- Configure alerts for:
- High error rates.
- Increased execution durations.
- Resource throttling.
- Use AWS CloudWatch Alarms or third-party integrations like PagerDuty for incident management.
6. Monitor Cold Starts
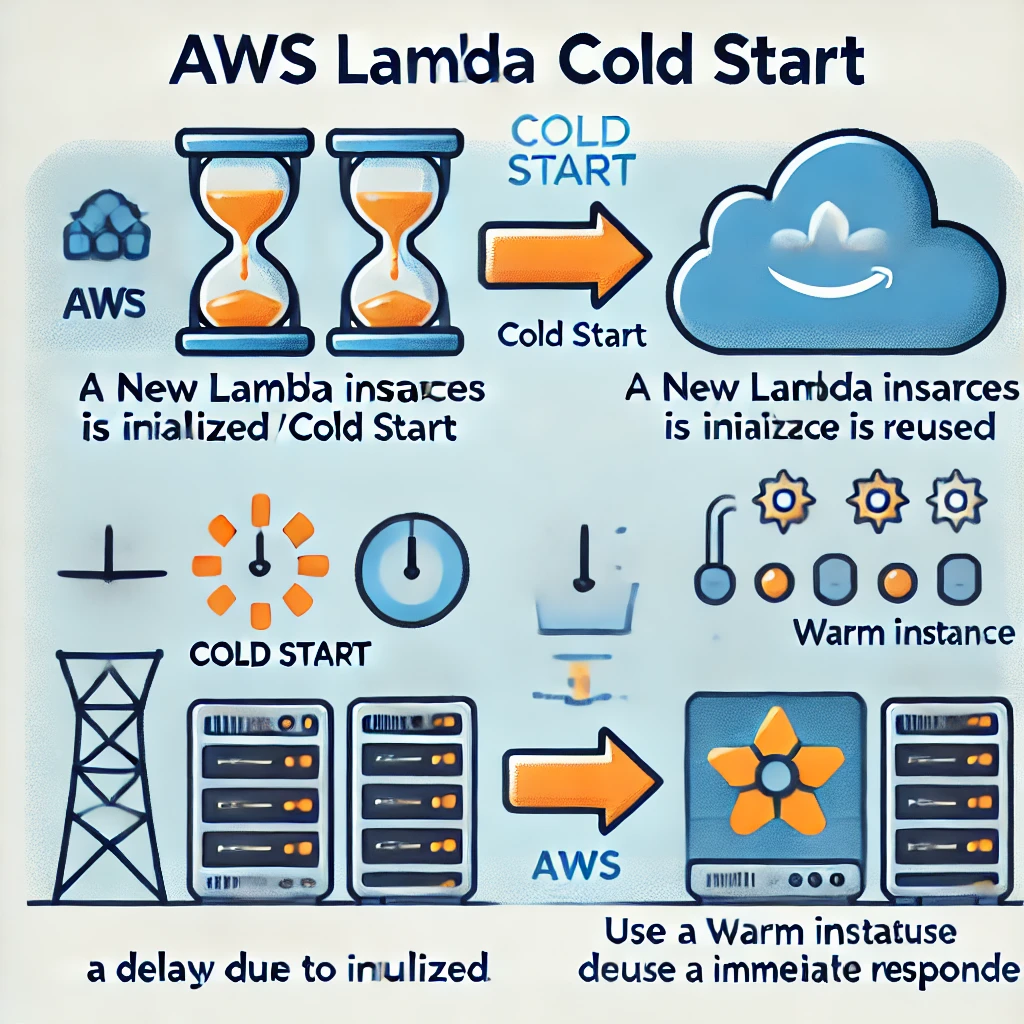
- Identify functions with frequent cold starts and optimize them by:
- Increasing memory allocation.
- Minimizing package size.
- Using provisioned concurrency.
Best Practices for Observability in Serverless
- Correlate Metrics, Logs, and Traces
- Use unique identifiers to connect data from different sources.
- Optimize Log Retention
- Set appropriate retention policies to balance cost and troubleshooting needs.
- Focus on Security Monitoring
- Track unauthorized access attempts and unusual activity.
- Adopt Automation
- Use frameworks like Serverless Framework or AWS CDK to automate observability instrumentation.
- Continuously Improve
- Regularly review and update your observability setup as your architecture evolves.
Conclusion
Observability is a cornerstone of successful serverless applications. By implementing robust observability practices, you can ensure your application is reliable, performant, and cost-efficient. Whether you’re using AWS-native tools like CloudWatch and X-Ray or integrating third-party solutions, the key is to focus on collecting actionable data and gaining meaningful insights. Start building observability into your serverless architecture today and unlock the full potential of serverless computing.
Akbar Majeed
Author Akbar is a seasoned cloud solutions architect, software developer, and web developer with over 20 years of experience in the tech industry. With expertise in Angular, Node.js, Ionic, and a deep passion for AWS serverless technologies, Akbar specializes in building scalable and efficient applications. Currently delving into NestJS and serverless architectures, Akbar enjoys sharing knowledge and simplifying complex concepts for developers of all levels. When not coding, Akbar actively participates in Toastmasters, honing public speaking and leadership skills. for video lectures,follow youtube channel, https://www.youtube.com/@w3cloudstudio


